Analysing Customer Dynamics with PowerBI
IDEAS: Customer Segmentation Retetion/Churn Value of your customer database Projection Customer, loyality, retention and value Movements Segments Dynamics PAST- Retention, Churn PRESENT- Segments, Value FUTURE -Projection of segmetns and value WHY IS THIS IMPORTANT? Because it would help you unlock the direction of your customer database and improve your retention strategy. Replicabel with your transactional dataset
Understanding our Customer Database is essential to understand our business. Not only which are the loyal clients, the new ones, the ones that are more likely to churn or the high value ones, but also understanding the dynamics between this groups and what is the trend moving forward.
We can learn about what makes a customer stay or leave and define out strategy by simply analyzing historical transactional data.
For this example I will use a dataset provide by the UCI, which contains all the transactions occurring between 01/12/2010 and 09/12/2011 for a UK-based and registered non-store online retail.
Here’s a sample of the dataset:
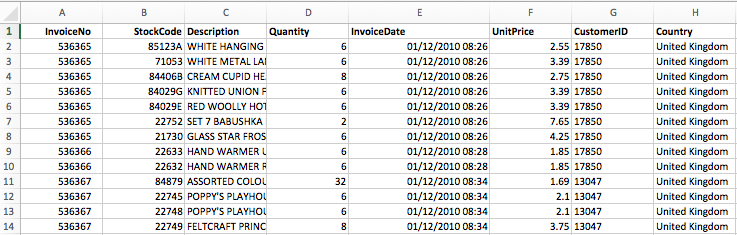
As you can see, is a very common transantional dataset which means we can easily reproduce this analysis with any company’s transactional data containing the customer, the purchase and the date.
STEP 1. Define the periods you want to analyze
We are interested on segmenting our database and also analyze the movements between those segments over time. Therefore, we need to define the periods we are interested in comparing. This periods selection is important since it will define what we call a churn or a new client, for instance.
In this case, we only have 12 monhts of data and we will look at three monhts (or quarter) periods.
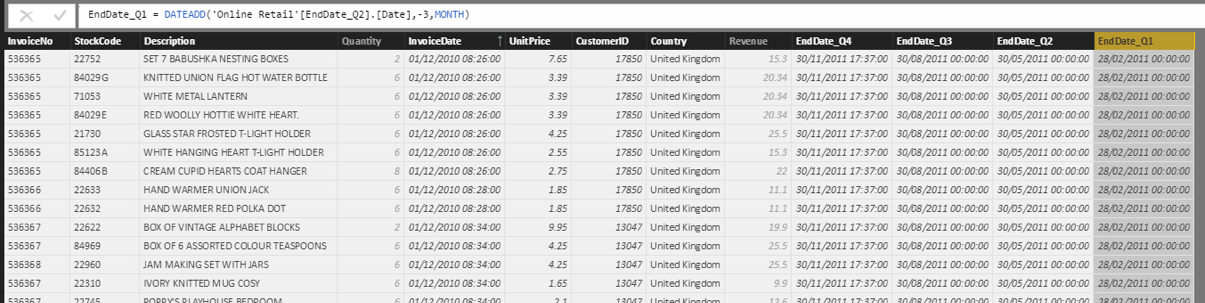
What we need now is to create one column for each of the periods indicating the end date. In this case I am going to define the end dates so that I always compare the last 3 months with the previous 3 monhts, this way whenever I get new data the columns will authomatically update showing the right end dates for my data. However, this could be fixed to be specific business quuarters or years. We will use the 3 rolling months method for this example
EndDate_Q4 = MAX('Online Retail'[InvoiceDate])
EndDate_Q3 = DATEADD('Online Retail'[EndDate_Q4].[Date],-3,MONTH)
EndDate_Q2 = DATEADD('Online Retail'[EndDate_Q3].[Date],-3,MONTH)
EndDate_Q1 = DATEADD('Online Retail'[EndDate_Q2].[Date],-3,MONTH)
STEP 2. Measures: First booking, Last Booking and Monetary value
Now, let’s find some clients characteristics. We are interested on understanding these for each of the periods so that we can analyze the changes between them.
The three things we are interested in are: When did the client book for the first time?
When did the client book for the last time?
How much money has the client spend with us?
The first booking date won’t change from period to period so we only need to create one measure.
First Booking Date =
CALCULATE(min([InvoiceDate]),ALLEXCEPT('Online Retail','Online Retail'[CustomerID]))
The last booking date, however, is the last booking date previous to end of the period. Therefore we need to compute one measure for each period.
Last Booking date_Q4 = CALCULATE(MAX('Online Retail'[InvoiceDate]),
FILTER('Online Retail','Online Retail'[InvoiceDate]<=[EndDate_Q4]),ALLEXCEPT('Online Retail','Online Retail'[CustomerID]))
Last Booking date_Q3 = CALCULATE(MAX('Online Retail'[InvoiceDate]),
FILTER('Online Retail','Online Retail'[InvoiceDate]<=[EndDate_Q3]),ALLEXCEPT('Online Retail','Online Retail'[CustomerID]))
Last Booking date_Q2 = CALCULATE(MAX('Online Retail'[InvoiceDate]),
FILTER('Online Retail','Online Retail'[InvoiceDate]<=[EndDate_Q2]),ALLEXCEPT('Online Retail','Online Retail'[CustomerID]))
Last Booking date_Q1 = CALCULATE(MAX('Online Retail'[InvoiceDate]),
FILTER('Online Retail','Online Retail'[InvoiceDate]<=[EndDate_Q1]),ALLEXCEPT('Online Retail','Online Retail'[CustomerID]))
Using the last booking date measures created let’s compute the recency of a client, i.e., the days since its last purchase.
Recency_Q4 = DATEDIFF([Last Booking date_Q4],MAX('Online Retail'[EndDate_Q4]),DAY)
Recency_Q3 = DATEDIFF([Last Booking date_Q4],MAX('Online Retail'[EndDate_Q3]),DAY)
Recency_Q2 = DATEDIFF([Last Booking date_Q4],MAX('Online Retail'[EndDate_Q2]),DAY)
Recency_Q1 = DATEDIFF([Last Booking date_Q4],MAX('Online Retail'[EndDate_Q1]),DAY)
The last measure we want to compute is the total spend of the client during each of the periods.
Revenue_Q4 = CALCULATE(sum('Online Retail'[Revenue]),FILTER('Online Retail','Online Retail'[InvoiceDate]>'Online Retail'[EndDate_Q3]))
Revenue_Q3 = CALCULATE(sum('Online Retail'[Revenue]),FILTER('Online Retail',AND('Online Retail'[InvoiceDate]<='Online Retail'[EndDate_Q3],'Online Retail'[InvoiceDate]>'Online Retail'[EndDate_Q2])))
Revenue_Q2 = CALCULATE(sum('Online Retail'[Revenue]),FILTER('Online Retail',AND('Online Retail'[InvoiceDate]<='Online Retail'[EndDate_Q2],'Online Retail'[InvoiceDate]>'Online Retail'[EndDate_Q1])))
Revenue_Q1 = CALCULATE(sum('Online Retail'[Revenue]),FILTER('Online Retail','Online Retail'[InvoiceDate]<='Online Retail'[EndDate_Q1]))
STEP 3. Segments
With the measures ready we can now create our customer segmentent for each or the periods.
There two factors that we want to take into account, one is the status of the client (i.e. active, new, churn..) and the other is the value (i.e. high or low spender).
We will define the status of a customer as follow:
Active: New: Churn: Quick Churn:
We can define our Status Segments for each of the periods using the following formula:
Status_Q4 =
CALCULATE(
 IF([Recency_Q4]>180,"Churn",
 IF(AND([Recency_Q4]>90,[First Booking Date]>MAX('Online Retail'[EndDate_Q3])),
                                                                    "Quick Warm",
 IF([First Booking Date]>MAX('Online Retail'[EndDate_Q3]),"New",
 IF([Recency_Q4]>90,"Warm","Active" )))),
 ALLEXCEPT('Online Retail','Online Retail'[CustomerID]))
We will only create Status for the 3 more recent quarters because we do not have enough data to define the clients of the first quarter.
Let’s now decide what would be a high or low spenders. There are many different ways of defining hihg and low spenders and its company might have its prefernces.
In this case we are gonna define as high spender the top 20% of customers of each quarter. Remember that Using the Pareto graph that we played with on the previous post HERE we can understand the spend of our clients for each of the quarters. In our example 20% of the customers make up to 67% of the revenue and the revenue cutting point is around 1000 pounds (1157).
We can find those cutting points and hard code the low or high spenders measure, or we can use the measures built for the pareto analysis HERE to cut of on the top 20% of our customers each time.
REMINDER BOX The three measures are: Customer Count Ranking Customer by Revenue: % of Customers
Then we can use the % of Customers measure for our high or low spenders measure
HighorLow_Q4 =
	IF(
		CALCULATE([% Customers],FILTER('Online Retail','Online Retail'[InvoiceDate]>'Online Retail'[EndDate_Q2])), "High Value","Low Value"
		)
HighorLow_Q3 =
	IF(
		CALCULATE([% Customers],FILTER('Online Retail',
			AND('Online Retail'[InvoiceDate]>'Online Retail'[EndDate_Q2],'Online Retail'[InvoiceDate]<='Online Retail'[EndDate_Q3]))),
			 "High Value","Low Value"
		)
	```
HighorLow_Q2 = IF( CALCULATE([% Customers],FILTER(‘Online Retail’, AND(‘Online Retail’[InvoiceDate]>‘Online Retail’[EndDate_Q1],‘Online Retail’[InvoiceDate]<=‘Online Retail’[EndDate_Q2]))), “High Value”,“Low Value” ) ```
    ```
    HighorLow_Q1 =
IF(
    CALCULATE([% Customers],FILTER('Online Retail',
        'Online Retail'[InvoiceDate]<='Online Retail'[EndDate_Q1])),
         "High Value","Low Value"
    )
    ```
Finally we are ready to define the segments for each of the periods
Segment_Q4 = CONCATENATE([Status_Q4],[HighorLow_Q4])
Segment_Q3 = CONCATENATE([Status_Q3],[HighorLow_Q3])
Segment_Q2 = CONCATENATE([Status_Q2],[HighorLow_Q2
])
STEP 4. Create a new table with the relevant measures
In order to be able to create graphs easily, we will create a simple table with each customer and the created measures as columns. That would give us a lot more flexibility to plot an analazy our segments.
Customer Segments = ADDCOLUMNS(SUMMARIZE('Online Retail','Online Retail'[CustomerID]),
                       "First Booking",[First Booking Date],
                       "Revenue_Q4",[Revenue_Q1],
                       "Status_Q4",[Status_Q4],
                       "HighorLow_Q4",[HighorLow_Q4],
                        "Sement_Q4",[Segment_Q4],
                        "Revenue_Q3",[Revenue_Q3],
                       "Status_Q3",[Status_Q3],
                       "HighorLow_Q3",[HighorLow_Q3],
                        "Sement_Q3",[Segment_Q3],
                        "Revenue_Q2",[Revenue_Q2],
                       "Status_Q2",[Status_Q2],
                       "HighorLow_Q2",[HighorLow_Q2],
                        "Sement_Q2",[Segment_Q2])
